
Consumer Price Index, Georgetown, Guyana: February, 2025
Georgetown Consumer Price Index – February 2025/January 2025
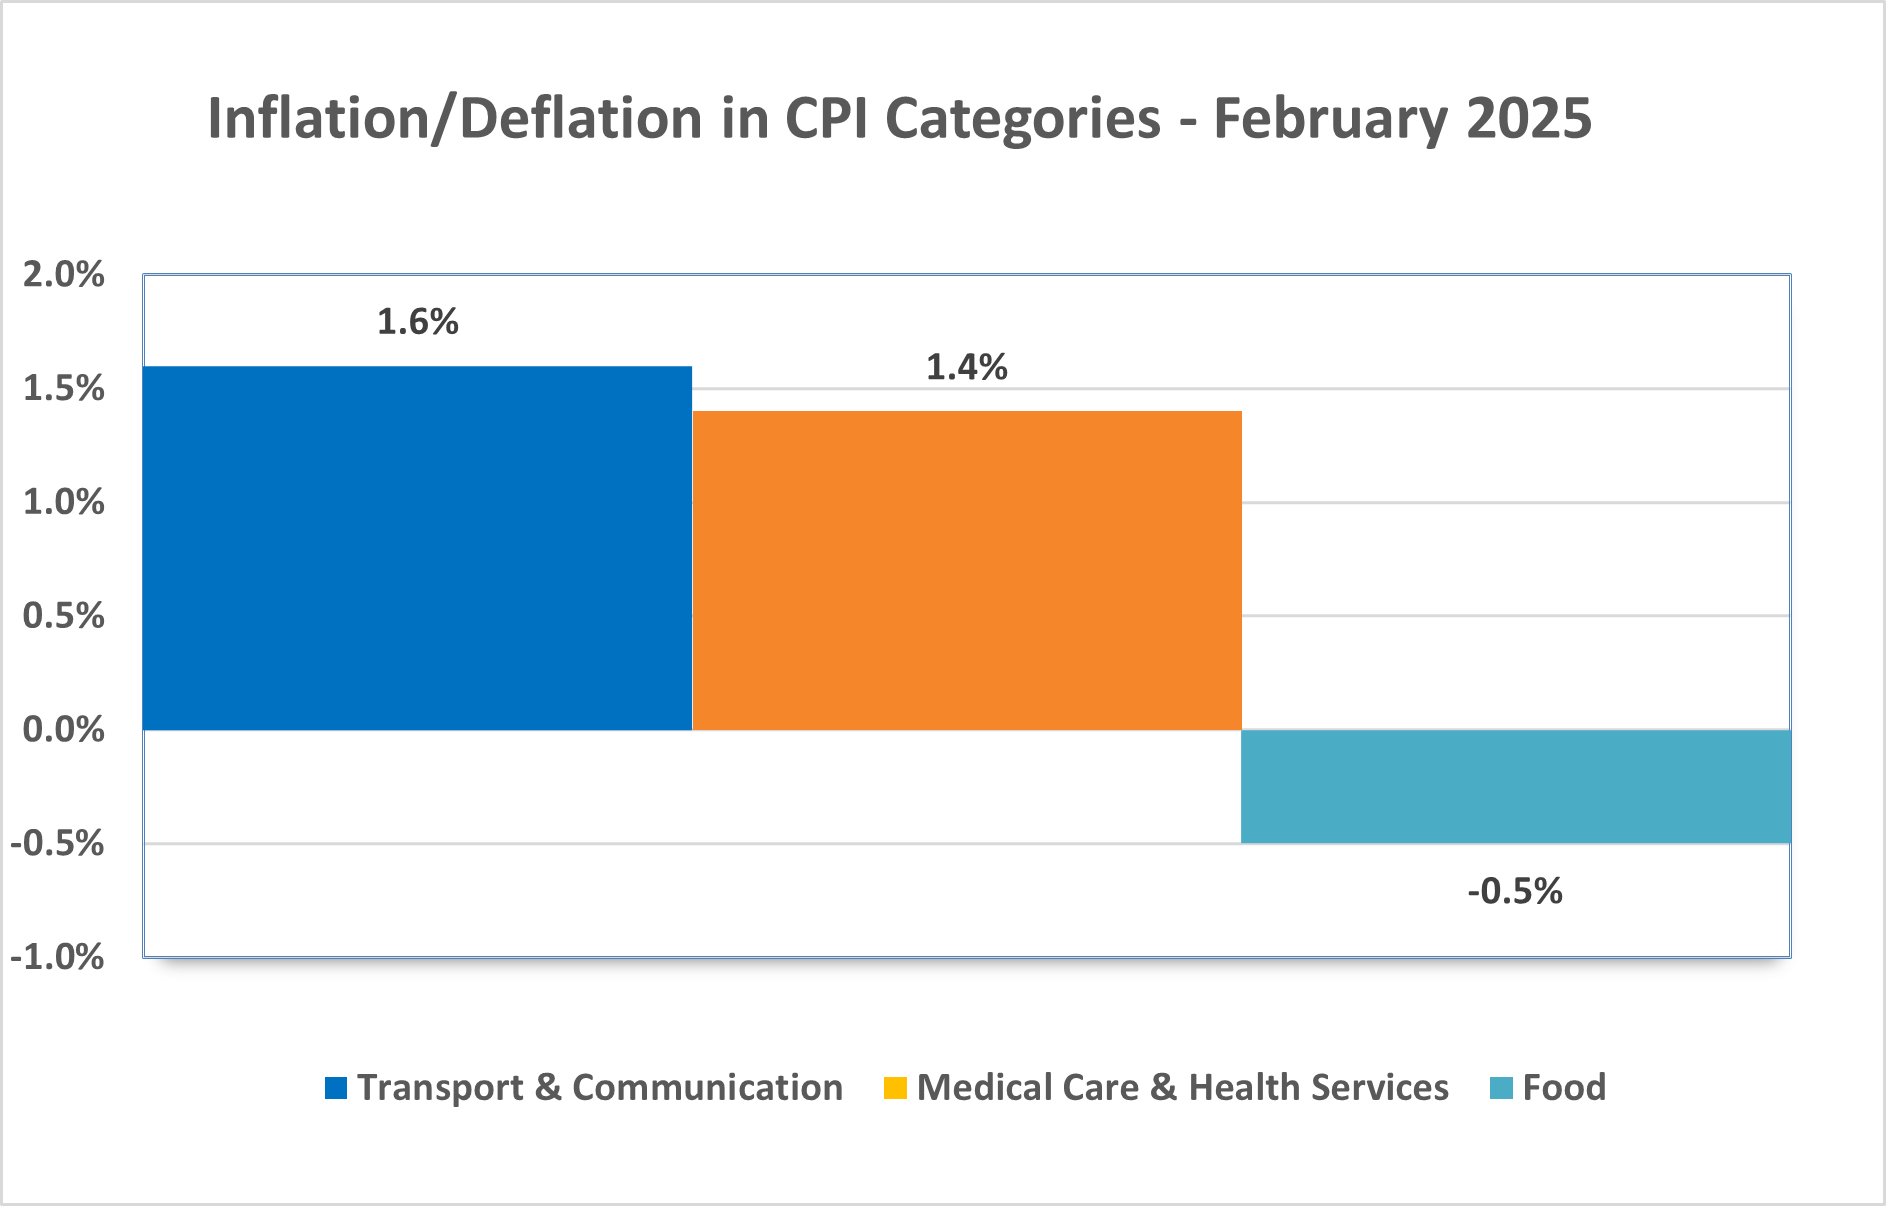
At the end of February 2025, the Georgetown Consumer Price Index (CPI) was recorded at 143.16, an increase from 143.12 at the end of January 2025, indicating a monthly inflation rate of 0.03 %. The primary contributors to the increase were the Transport & Communication (1.6%) and Medical Care & Health Services (1.4%) categories.
In the Transport and Communication category, inflation is attributed to increases in the prices of goods and services within the Purchased Transport Services (4.4%) subcategory. Meanwhile, the inflation in the Medical Care & Health Services category, the increases in prices of goods and services within the Hospital/Clinic Fees (3.3%) subcategory.
The Food category recorded a deflation of -0.5% mainly due to decreases in the prices of Vegetable & vegetable products (-3.7%) subcategory. Although the category recorded an overall deflation, there was inflation in some subcategories, inclusive of Fruits & Fruit Products (2.8%), Condiments & Spices (2.1%), and Non-alcoholic Beverages (0.9).
Over the past 12 months, the Consumer Price Index (CPI) rose by 3.0%, largely driven by significant price increases in various categories: Food (5.0%), Education, Recreation, and Cultural Services (3.1%), Medical Care and Health Services (2.9%), Miscellaneous Goods and Services (2.1%), Transport and Communication (1.7%).
| Consumer Price Index, Georgetown, Guyana: February 2025. | DEC 2009=100 | ||||||||||||
| DEC.2018 | DEC.2019 | DEC.2020 | DEC.2021 | DEC.2022 | DEC.2023 | DEC.2024 | FEB.2024 | JAN.2025 | FEB.2025 | % change ( FEB 2025 - JAN 2025 ) | % change (FEB 2025-FEB 2024) | ||
| ALL ITEMS | 117.08 | 119.51 | 120.65 | 127.49 | 136.72 | 139.43 | 143.51 | 138.94 | 143.12 | 143.16 | 0.03 | 3.0 | |
| I | FOOD | 138.48 | 147.02 | 152.51 | 170.26 | 194.23 | 201.57 | 212.92 | 199.97 | 211.17 | 210.05 | -0.5 | 5.0 |
| II | CLOTHING | 94.16 | 89.30 | 89.04 | 87.94 | 88.27 | 88.17 | 88.17 | 88.17 | 88.17 | 88.17 | 0.0 | 0.0 |
| III | FOOTWEAR AND REPAIRS | 82.41 | 81.45 | 80.75 | 80.78 | 81.00 | 81.11 | 81.11 | 81.11 | 81.14 | 81.14 | 0.0 | 0.0 |
| IV | HOUSING | 100.35 | 99.55 | 97.32 | 97.10 | 98.56 | 98.63 | 98.80 | 98.68 | 98.82 | 98.98 | 0.2 | 0.3 |
| V | FURNITURE | 90.64 | 89.87 | 90.46 | 93.96 | 96.69 | 97.17 | 96.78 | 96.61 | 97.10 | 97.32 | 0.2 | 0.7 |
| VI | TRANSPORT & COMMUNICATION | 120.26 | 119.49 | 117.90 | 120.57 | 121.96 | 122.09 | 122.21 | 122.02 | 122.19 | 124.09 | 1.6 | 1.7 |
| VII | MEDICAL CARE AND HEALTH SERVICES | 129.61 | 129.90 | 136.55 | 138.76 | 138.98 | 140.75 | 141.67 | 140.16 | 142.24 | 144.18 | 1.4 | 2.9 |
| VIII | EDUCATION, RECREATION & CULTURAL SERVICES | 96.01 | 96.41 | 96.73 | 96.38 | 96.63 | 96.79 | 99.94 | 96.89 | 99.94 | 99.94 | 0.0 | 3.1 |
| IX | MISCELLANEOUS GOODS & SERVICES | 120.27 | 120.89 | 122.56 | 125.89 | 130.25 | 132.43 | 133.74 | 134.03 | 136.79 | 136.84 | 0.0 | 2.1 |
| Source: Bureau of Statistics |