
Consumer Price Index, Georgetown, Guyana: January, 2025
Georgetown Consumer Price Index –December 2024/January2025
At the end of January 2025, the Georgetown Consumer Price Index (CPI) was recorded at 143.12, a decrease from 143.51 at the end of December 2024, indicating a monthly deflation rate of -0.3 %. The primary contributor to the decrease was the Food category, which declined by -0.8 %.
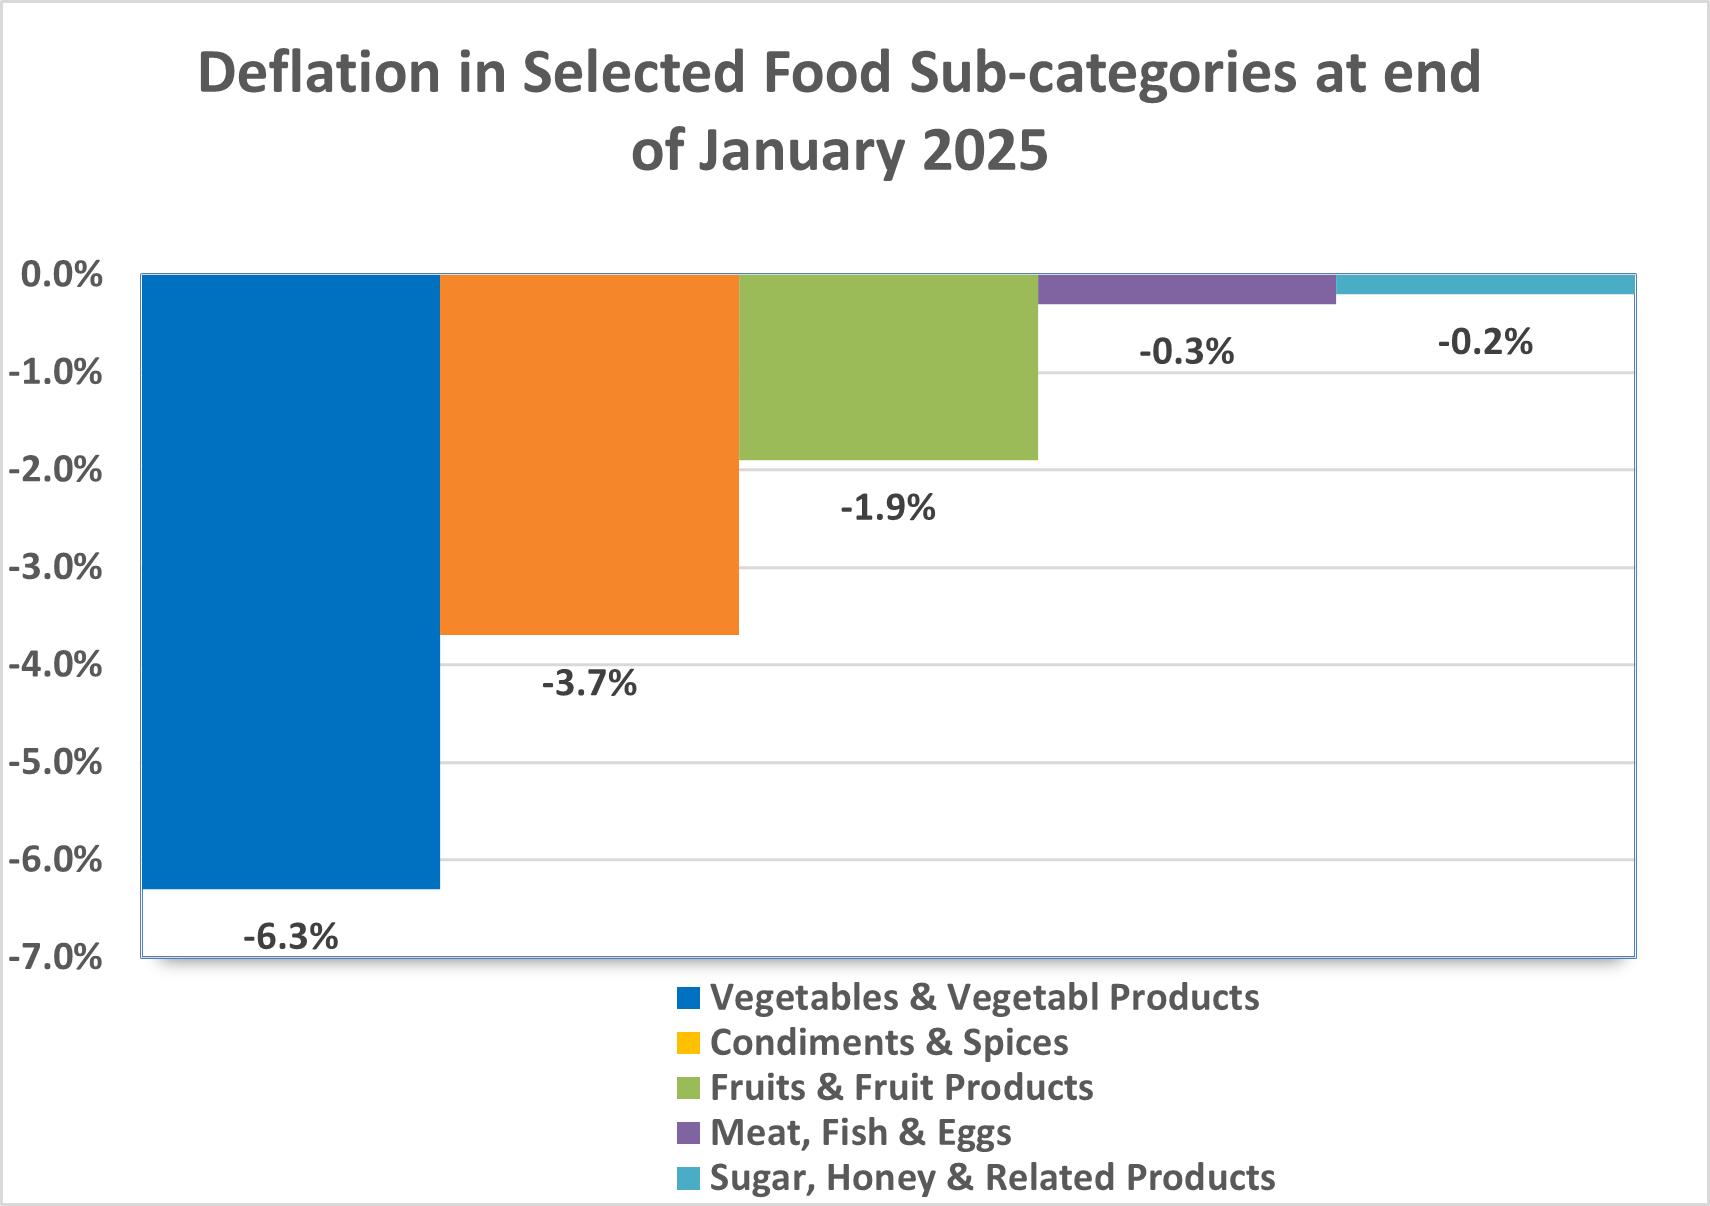
The price decreases within the Food category were primarily due to lower costs for Vegetables & Vegetable Products (-6.3%), Condiments & Spices (-3.7%), Fruits & Fruit Products (-1.9%), Meat, Fish & Eggs (-0.3%) and Sugar, Honey & Related Products (-0.2%). Conversely, the following sub-categories saw increases: Prepared Meals & Refreshments (10.0%), Pulses & Pulse Products (2.9%), Alcoholic Beverages & Intoxicants (1.9%), Oil & Fats (excluding Butter) (0.9%), Non-alcoholic Beverages (0.5%), Cereals & Cereal Products (0.3%) and Milk & Milk Products (0.2%).
Noteworthy, within the non-food categories, the sub-categories Expenditure in Restaurant & Cafes (20.1%), Personal Care Services (6.4%), Goods Not Elsewhere Classified (3.5%), Repairs to Footwear (1.4%), Cleaning Materials (1.2%), Medical & Personal Care (0.7%) and Fuel & Power (0.1%) there were increases. In contrast, the sub-categories Therapeutic Appliances (-1.0%), Goods for Personal Care (-0.3%) and Purchased Transport Services (-0.1%) recorded decreases.
Over the past 12 months, the Consumer Price Index (CPI) rose by 3.1%, largely driven by significant price increases in various categories: Food (5.6%), Miscellaneous Goods and Services (3.2%), Education, Recreation, and Cultural Services (3.1%), Furniture (0.5%), Housing (0.2%) and Transport and Communication (0.1%). Conversely, the Medical Care and Health Services category recorded a decline of -0.1% during this period.
| Consumer Price Index, Georgetown: January 2025. | ||||||||||||
| DEC.2018 | DEC.2019 | DEC.2020 | DEC.2021 | DEC.2022 | DEC.2023 | JAN.2024 | DEC.2024 | JAN.2025 | % change ( DEC 2024 - JAN 2025 ) | % change ( JAN 2024 - JAN 2025 ) | ||
| ALL ITEMS | 117.08 | 119.51 | 120.65 | 127.49 | 136.72 | 139.43 | 138.86 | 143.51 | 143.12 | -0.3 | 3.1 | |
| I | FOOD | 138.48 | 147.02 | 152.51 | 170.26 | 194.23 | 201.57 | 199.99 | 212.92 | 211.17 | -0.8 | 5.6 |
| II | CLOTHING | 94.16 | 89.30 | 89.04 | 87.94 | 88.27 | 88.17 | 88.17 | 88.17 | 88.17 | 0.0 | 0.0 |
| III | FOOTWEAR AND REPAIRS | 82.41 | 81.45 | 80.75 | 80.78 | 81.00 | 81.11 | 81.11 | 81.11 | 81.14 | 0.0 | 0.0 |
| IV | HOUSING | 100.35 | 99.55 | 97.32 | 97.10 | 98.56 | 98.63 | 98.63 | 98.80 | 98.82 | 0.0 | 0.2 |
| V | FURNITURE | 90.64 | 89.87 | 90.46 | 93.96 | 96.69 | 97.17 | 96.58 | 96.78 | 97.10 | 0.3 | 0.5 |
| VI | TRANSPORT & COMMUNICATION | 120.26 | 119.49 | 117.90 | 120.57 | 121.96 | 122.09 | 122.01 | 122.21 | 122.19 | 0.0 | 0.1 |
| VII | MEDICAL CARE AND HEALTH SERVICES | 129.61 | 129.90 | 136.55 | 138.76 | 138.98 | 140.75 | 142.44 | 141.67 | 142.24 | 0.4 | -0.1 |
| VIII | EDUCATION, RECREATION & CULTURAL SERVICES | 96.01 | 96.41 | 96.73 | 96.38 | 96.63 | 96.79 | 96.89 | 99.94 | 99.94 | 0.0 | 3.1 |
| IX | MISCELLANEOUS GOODS & SEVICES | 120.27 | 120.89 | 122.56 | 125.89 | 130.25 | 132.43 | 132.50 | 133.74 | 136.79 | 2.3 | 3.2 |
| Source: Bureau of Statistics |