
Consumer Price Index, Georgetown, Guyana: January, 2026
Georgetown Consumer Price Index – January 2026/December 2025
The Georgetown Consumer Price Index (CPI) for January 2026 is 148.14, marking a 1.1-value increase and a 0.7% inflation rate compared to December 2025, which recorded an index of 147.05.
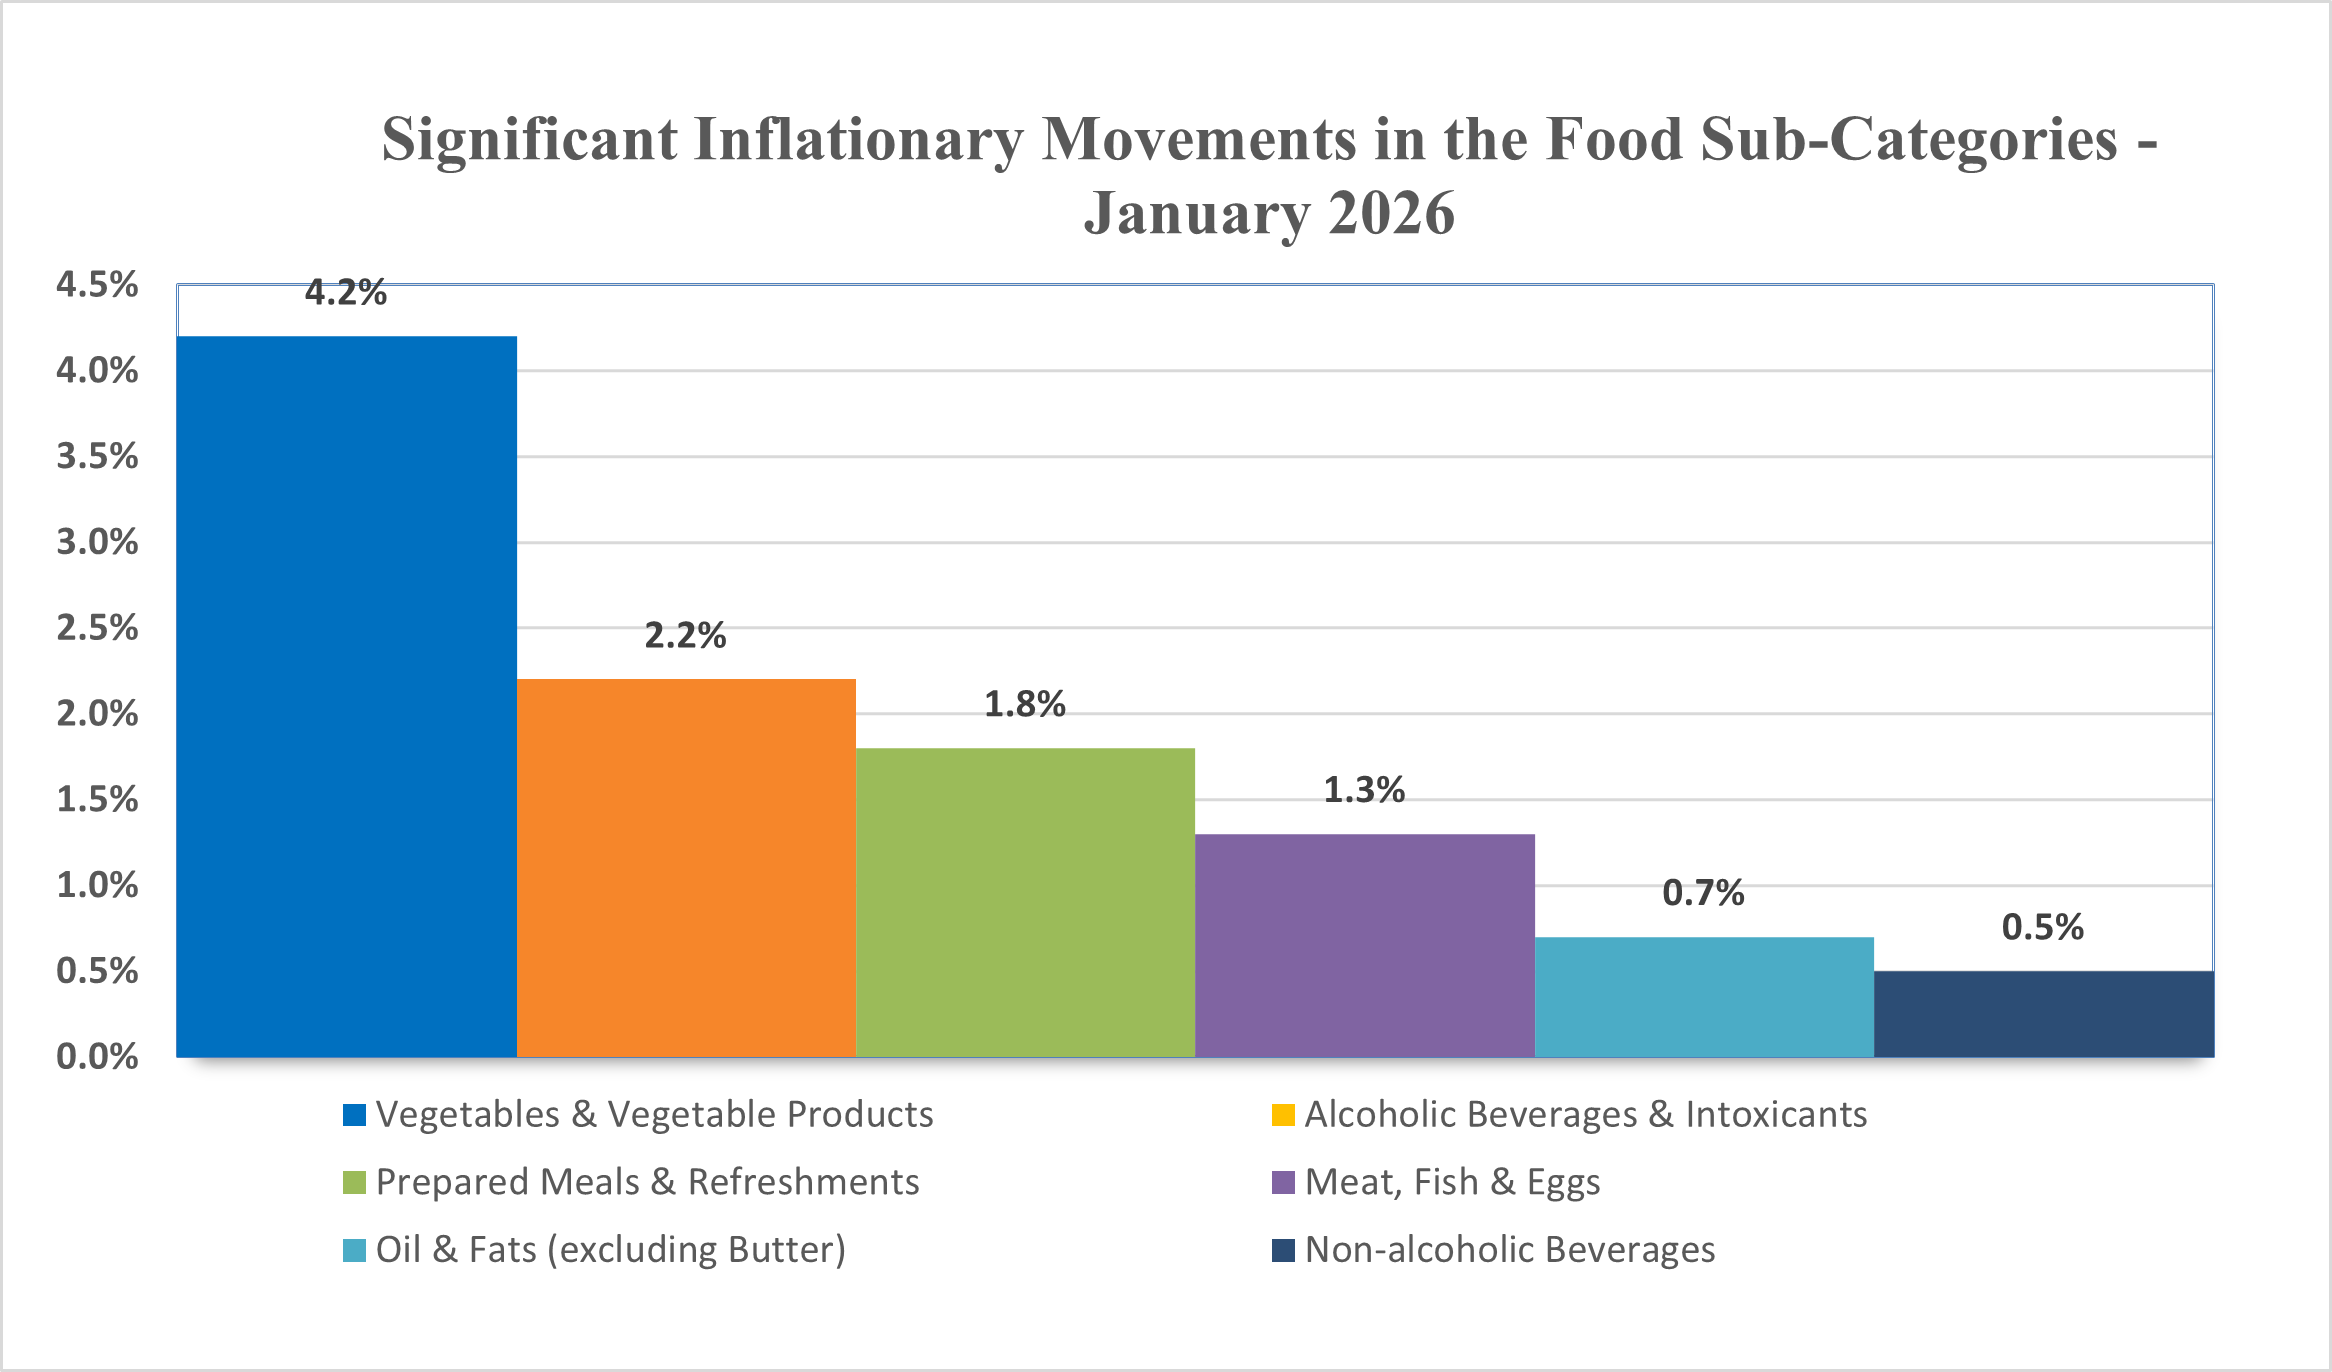
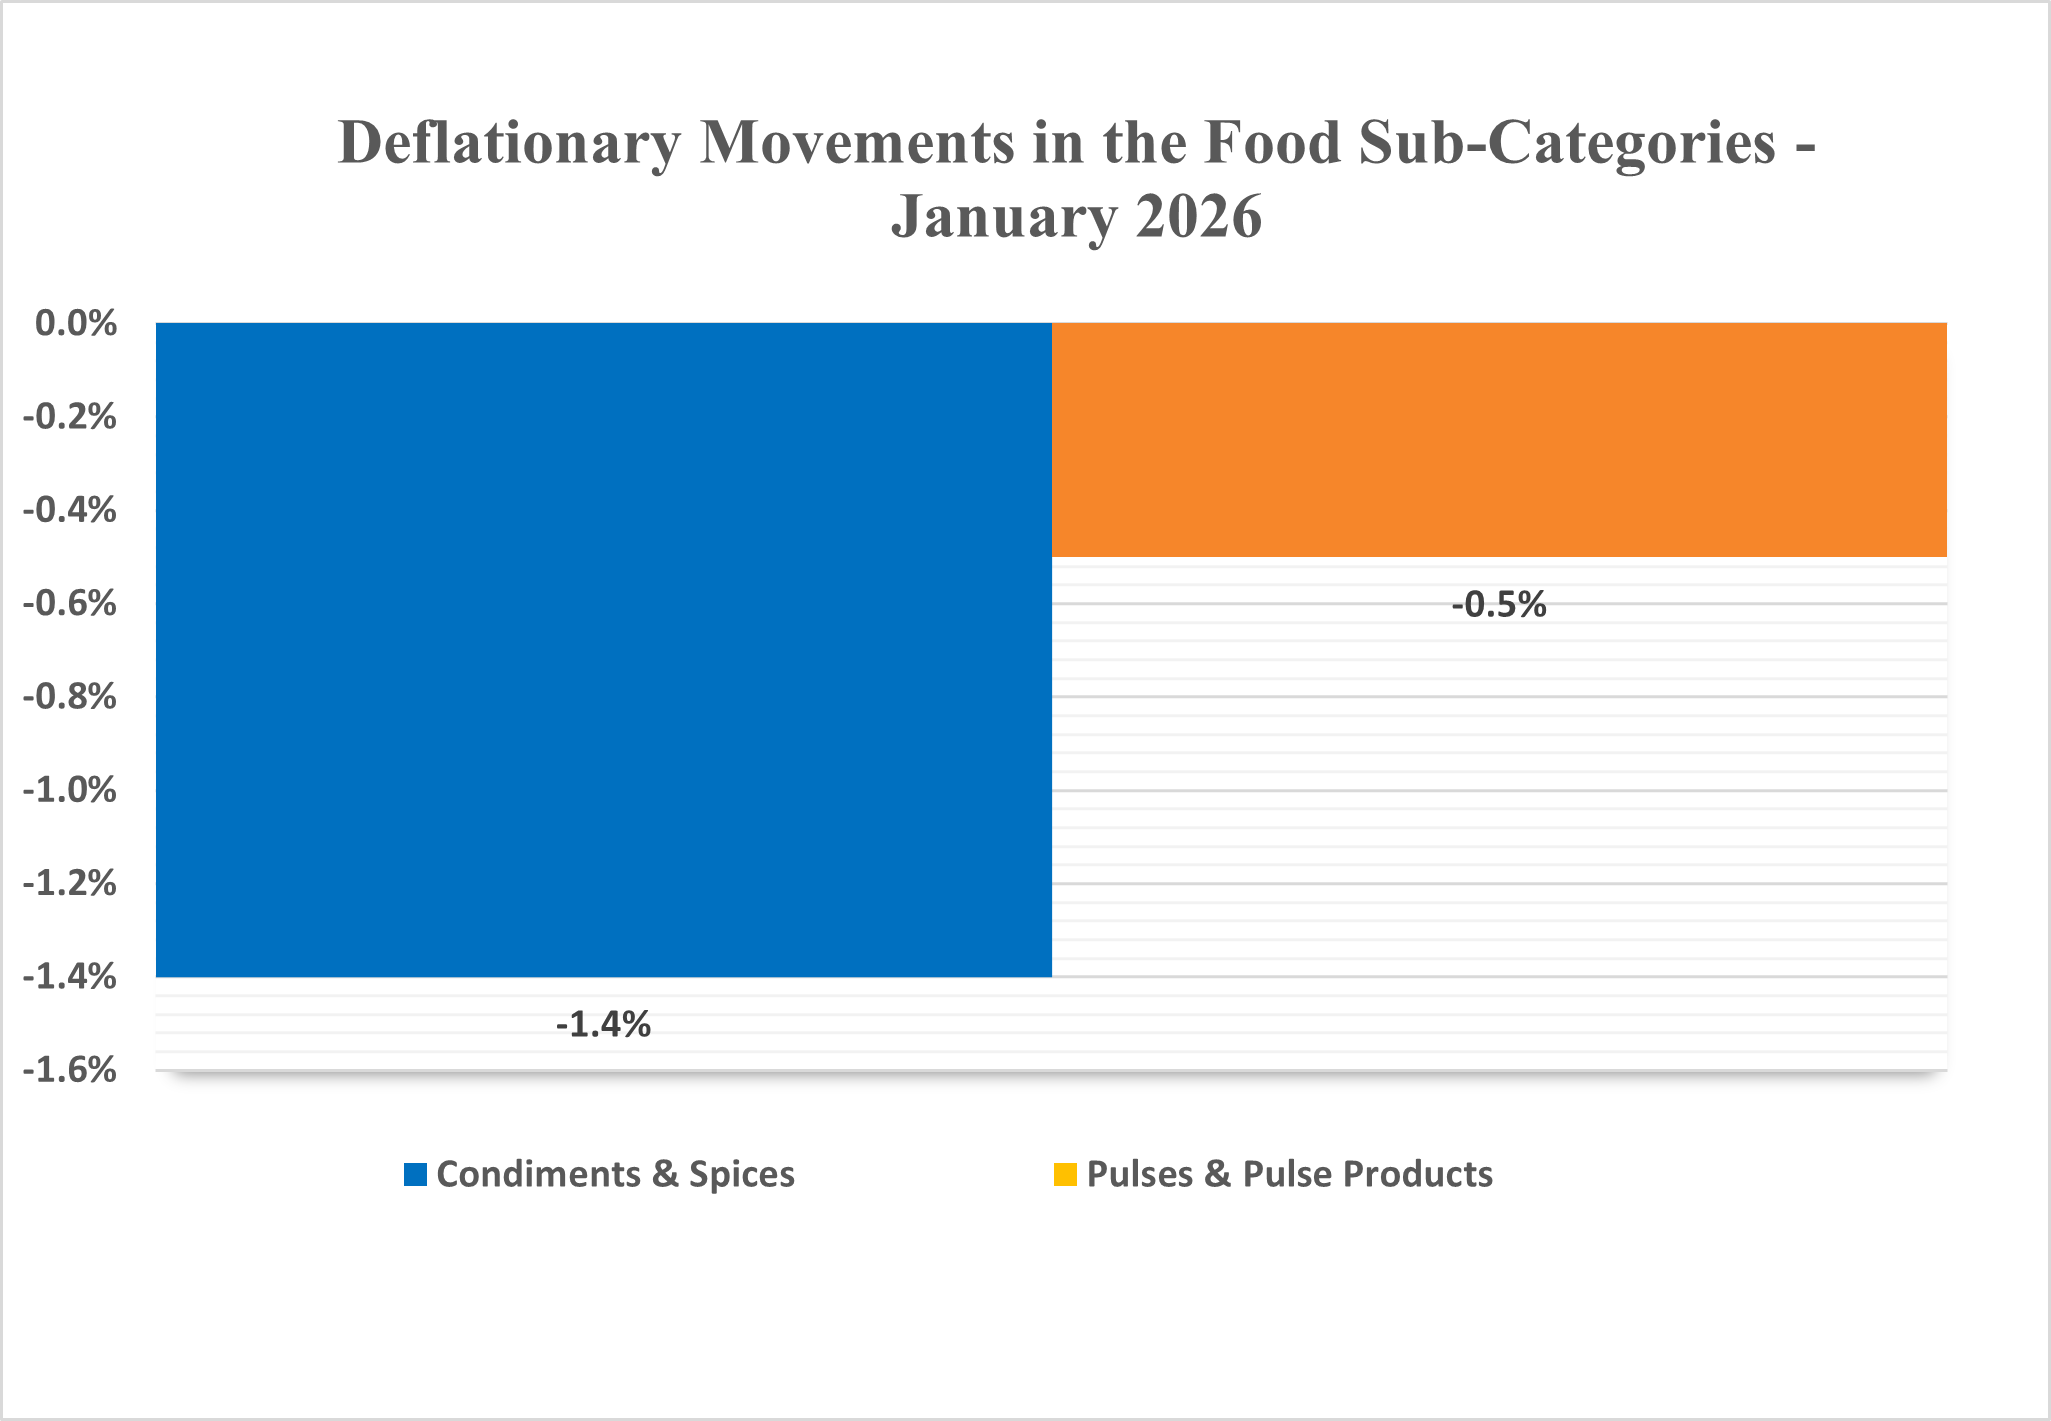
The primary contributor to the monthly inflation is the Food (1.3%) category. Significant sub-categories contributing to the rise in the Food category include Vegetables & Vegetable Products (4.2%), Alcoholic Beverages & Intoxicants (2.2%), Prepared Meals & Refreshments (1.8%), Meat, Fish & Eggs (1.3%), Oil & Fats (excluding Butter) (0.7%), Non-alcoholic Beverages (0.5%), Sugar, Honey & Related Products (0.3%), Fruits & Fruit Products (0.2%) and Cereals & Cereal Products (0.1%). The inflationary trend in this category was offset by the following sub-categories: Condiments & Spices (-1.4%) and Pulses & Pulse Products (-1.0%).
In the Non-Food Section, significant sub-categories contributing to the rise include Jewellery, Watched, etc. (13.2%), Expenditure in Restaurant & Cafes (1.6%), Purchased Transport Services (0.8%) and Cleaning Materials (0.1%). The inflationary trend in this section was offset by sub-category Medical & Personal Care (-0.5%).
Over the past 12 months, the Consumer Price Index (CPI) rose by 3.5%, largely driven by significant price increases in various categories: Food (6.7%), Miscellaneous Goods & Services (4.7%), Medical Care & Health Services (4.2%), Clothing (1.0%), Education, Recreation & Cultural Services (0.6%), Furniture (0.5%) and Transport & Communications (0.1%).
| Consumer Price Index, Georgetown, Guyana: January 2026. | DEC 2009 = 100 | ||||||||||||
| DEC | DEC | DEC | DEC | DEC | DEC | DEC | JAN | DEC | JAN | INFLATION/DEFLATION | |||
| 2018 | 2019 | 2020 | 2021 | 2022 | 2023 | 2024 | 2025 | 2025 | 2026 | JAN'26/DEC'25 | JAN'26/JAN'25 | ||
| ALL ITEMS | 117.08 | 119.51 | 120.65 | 127.49 | 136.72 | 139.43 | 143.51 | 143.12 | 147.05 | 148.14 | 0.7 | 3.5 | |
| I | FOOD | 138.48 | 147.02 | 152.51 | 170.26 | 194.23 | 201.57 | 212.92 | 211.17 | 222.32 | 225.31 | 1.3 | 6.7 |
| II | CLOTHING | 94.16 | 89.30 | 89.04 | 87.94 | 88.27 | 88.17 | 88.17 | 88.17 | 89.09 | 89.09 | 0.0 | 1.0 |
| III | FOOTWEAR AND REPAIRS | 82.41 | 81.45 | 80.75 | 80.78 | 81.00 | 81.11 | 81.11 | 81.14 | 81.14 | 81.14 | 0.0 | 0.0 |
| IV | HOUSING | 100.35 | 99.55 | 97.32 | 97.10 | 98.56 | 98.63 | 98.80 | 98.82 | 97.92 | 97.92 | 0.0 | -0.9 |
| V | FURNITURE | 90.64 | 89.87 | 90.46 | 93.96 | 96.69 | 97.17 | 96.78 | 97.10 | 97.59 | 97.63 | 0.0 | 0.5 |
| VI | TRANSPORT & COMMUNICATION | 120.26 | 119.49 | 117.90 | 120.57 | 121.96 | 122.09 | 122.21 | 122.19 | 121.94 | 122.28 | 0.3 | 0.1 |
| VII | MEDICAL CARE AND HEALTH SERVICES | 129.61 | 129.90 | 136.55 | 138.76 | 138.98 | 140.75 | 141.67 | 142.24 | 148.61 | 148.16 | -0.3 | 4.2 |
| VIII | EDUCATION, RECREATION & CULTURAL SERVICES | 96.01 | 96.41 | 96.73 | 96.38 | 96.63 | 96.79 | 99.94 | 99.94 | 100.56 | 100.56 | 0.0 | 0.6 |
| IX | MISCELLANEOUS GOODS & SEVICES | 120.27 | 120.89 | 122.56 | 125.89 | 130.25 | 132.43 | 133.74 | 136.79 | 142.79 | 143.18 | 0.3 | 4.7 |
| Source: Bureau of Statistics |